
Educational Graphics in Science
Educational graphics:
Educational graphics are often used as a way to teach one concept. As such, they tend to generalize the information in such a way that leaves out important information.
Take, for example the standard evolution depiction:
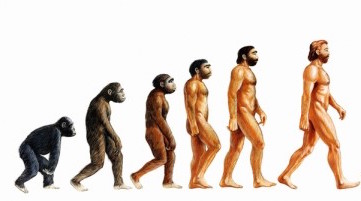
We use this image as a teaching tool, because it's easy to visual evolution this way. However, the graphic, isn't accurate in it's depiction of evolution because due to the simplicity of the graphic there is no knowledge of time, species extinction, A better graphic would be able to easily show all of this information.
The image below does a little better by including time information as well as showing the full evolution tree. This graphic makes clear the complex nature of evolution, but still leaves out many extinction events. (Click
here
to see a larger version of this image.)

For an example of commonly used well depicted graphic, we have this image showing the structure of the terrestrial planets.
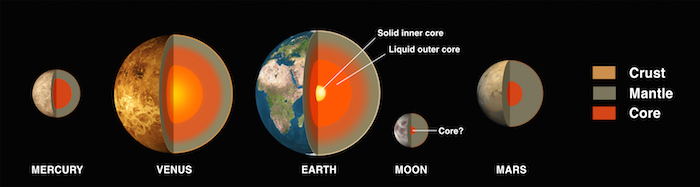
This graphic shows the relative size difference between the planets as well as their inside makeup. It even manages to show where we have incomplete information. There are lots of version of this graphic, but I think this one works the best because it uses labels and lines sparingly in place of a color coded legend.